 Contact
ECE 6390 Project
KungFu Project: W/V Band Satellite Design
Propagation and Phenomenon Model
The propagation phenomena concerning earth-space links mainly originate in the troposphere and the ionosphere.
Respectively, propagation effects are separated into two categories: ionospheric effects, influencing systems operating below 3GHz, and tropospheric effects, influencing systems operating above 3GHz. Since we deal only with the frequency spectrum above 10GHz, we focus on the tropospheric effects. The most important tropospheric phenomena affecting satellite communication systems at frequencies above 10GHz are summarized as follows.
Attenuation Due to Precipitation
When propagating through rain, snow, hail, or ice droplets, radiowaves suffer from power loss due to hydrometeor scattering

Fig.1 A satellite slant path affected by propagation impairments
The combined effect of hydrometeor scattering and absorption results in a power loss proportional in dB to the square of the frequency. This constitutes the main disadvantage of operating at the Ku, Ka, or V frequency bands. As far as satellite systems are concerned, the depth of rain fades also depends on the elevation and polarization angles. On the other hand, as rain attenuation depends unfavorably on the rainfall rate and the raindrop size distribution, it affects heavily tropical and subtropical regions. An indicative picture of rain fades is obtained from Fig. 2, which illustrates a typical fade incident with a peak value of 14dB.
Fig.2 Typical picture of attenuation fluctuations due to rain and scintillations
Gaseous Absorption
Besides hydrometeor absorption, gaseous absorption, mostly from oxygen and water vapor, con -tributes to the total attenuation of radiowaves, especially in the case of low elevation angles. However, the contribution of gaseous absorption to the total attenuation is small compared to the attenuation due to rain. In Fig. 3 the frequency dependence of oxygen and water vapor absorption is presented in terms of specific attenuation.

Fig.3 Specific attenuation vs. frequency. Curve A: mean global reference atmosphere; Curve B: dry atmosphere.
Cloud Attenuation:
The liquid water content of clouds is the physical cause of cloud attenuation. Prediction models for this particular attenuation factor have been developed within the framework of ITU-R and elsewhere. Figure 4 depicts attenuation values due to clouds and fog exceeded for a certain range of probabilities. The ITU-R model was selected as the underlying prediction method for generating these curves, which correspond to the three frequency bands examined in this survey. 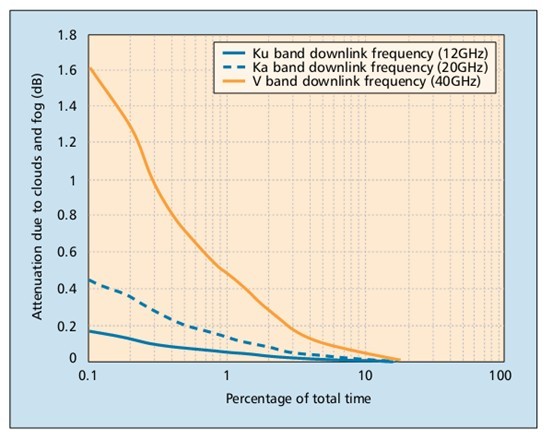
Fig. 4 Cloud plus fog attenuation vs. percentage of total time for a satellite link operating in Athen, Greece (elevation angle=30 degree)
Melting Layer Attenuation
At a certain height above ground level, called the effective rain height, snow and ice precipitation are converted into rain precipitation. The region around this height is called the melting layer. During periods of light rain and for low elevation angles, the melting layer contributes significantly to the total slant path attenuation, as verified by the relevant prediction model. Sky Noise Increase: As attenuation increases, so does emission noise (. The same factors previously mentioned, i.e. scatter/emission from precipitation hydrometeors, contribute to noise increase, which is more important than attenuation when earth stations with low noise front ends are considered.
Signal Depolarization
Differential phase shift and differ-ential attenuation caused by nonspherical scatterers cause signal depolarization. Although this phenomenon does not affect single polarized satellite systems, its effect becomes significant for systems reusing frequency by transmitting two orthogonally polarized signals for optimum RF spectrum utilization. In this case, depolarization results in cross-polar interference, i.e. part of the transmitted power in one polarization interferes with the orthogonally polarized signal. In Fig. 5 the relevant ITU-R method has been employed to demonstrate the long-term statistics of hydrometeor induced cross-polarization in the Athens, Greece area. The cross-polarization dis -crimination (XPD) not exceeded for various percentages of time is shown only at the Ku and Ka bands, since validity issues arise for the proposed model at frequencies above 35GHz.
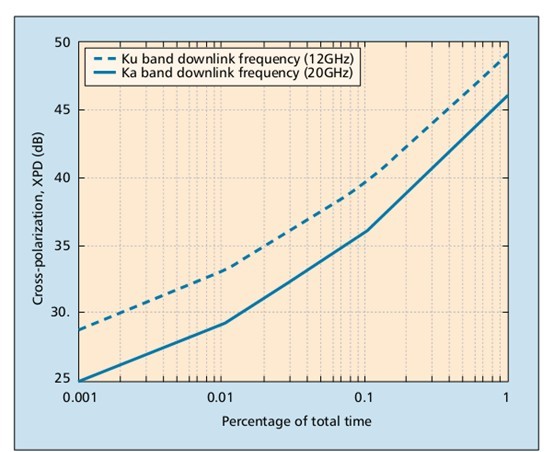
Fig.5 Cross-polarization vs. percentage of total time for a satellite link operating in Athens, Greece (elevation angle = 30 degree, vertical polarization)
Tropospheric Scintillations
Variations in the magnitude and the profile of the refractive index of the troposphere lead to amplitude fluctuations known as scintillations. These fluctuations increase with frequency and depend upon the length of the slant path decreasing with the antenna beamwidth. Amplitude fluctuations are also accompanied by a phase fluctuation.